Compare With Fit2d
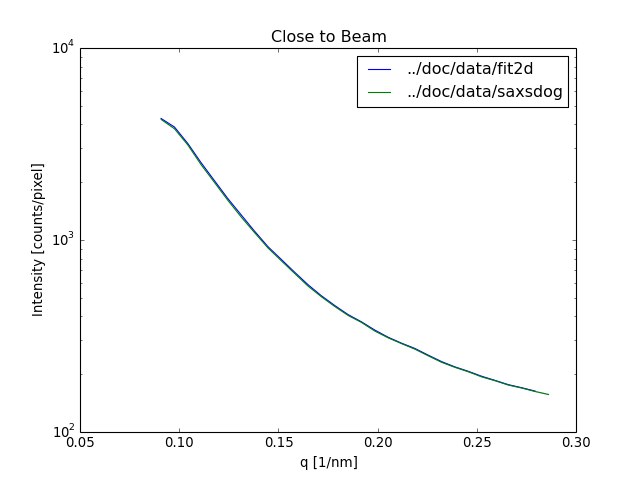
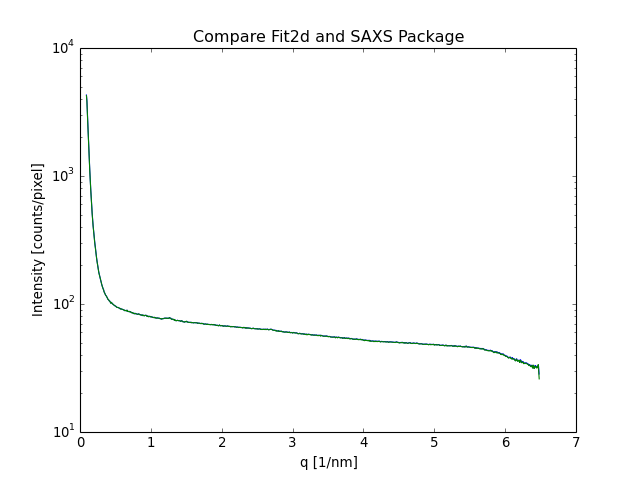
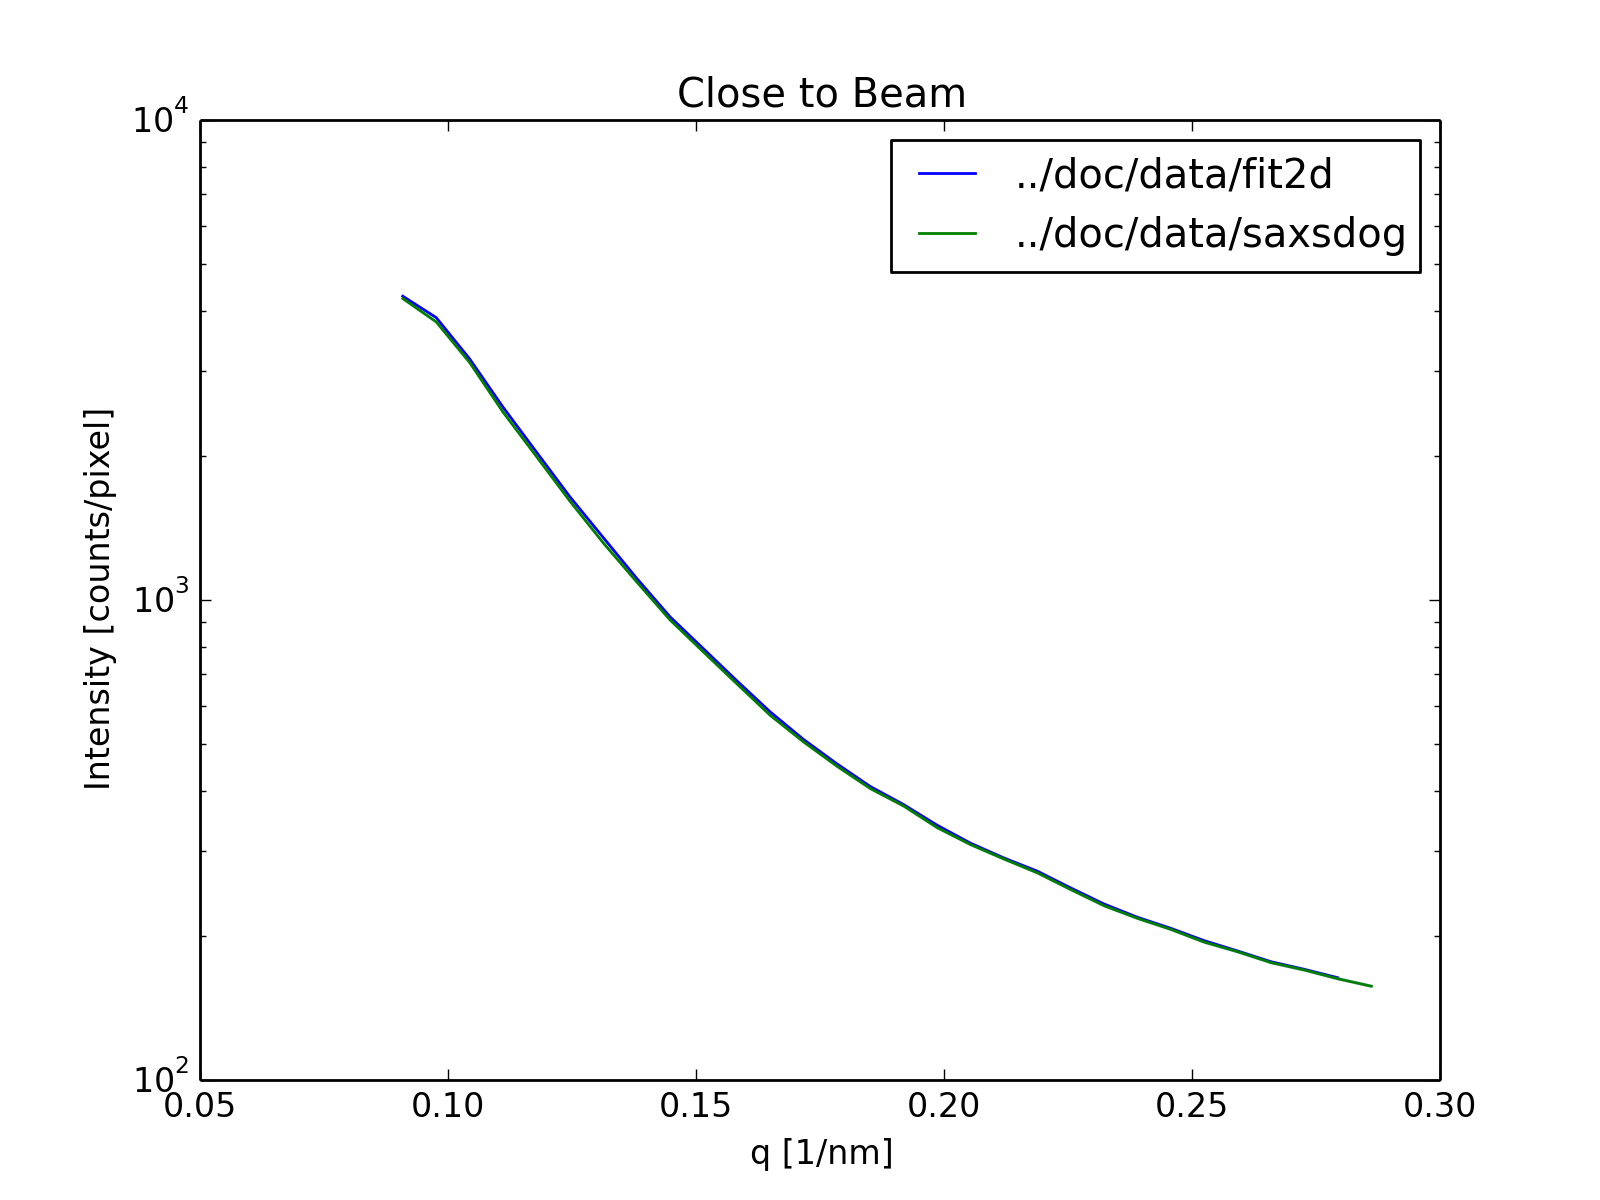
The program fit2d, which this package aims to partly replace, is the standard, so we better include a comparison plot here:
(Source code, png, hires.png, pdf)

Okay, this doesn’t show much but if we plot the difference:
(Source code, png, hires.png, pdf)
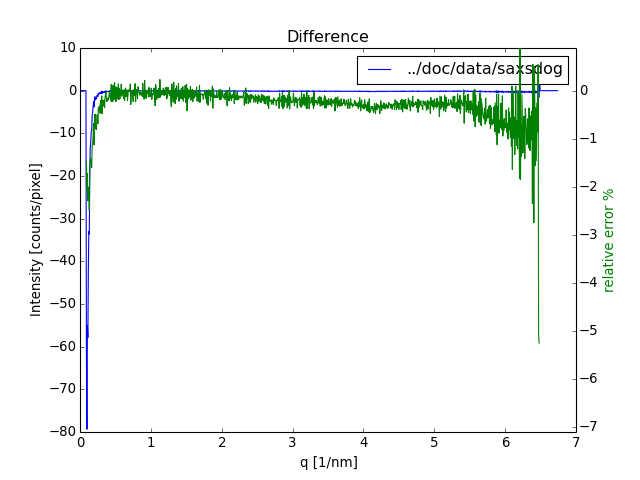
Still looks okay.
(Source code, png, hires.png, pdf)

(Source code, png, hires.png, pdf)
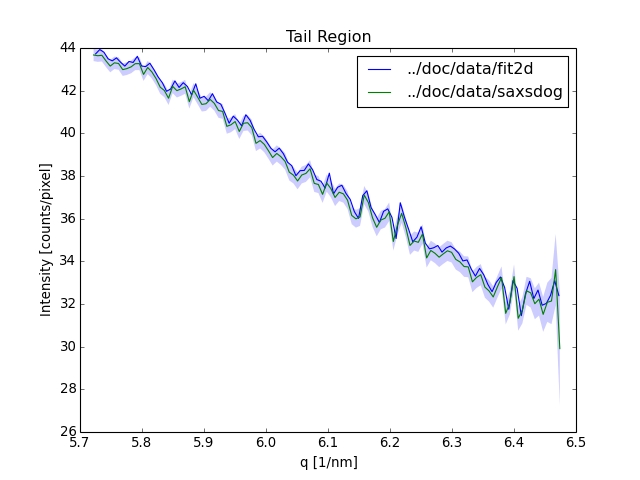
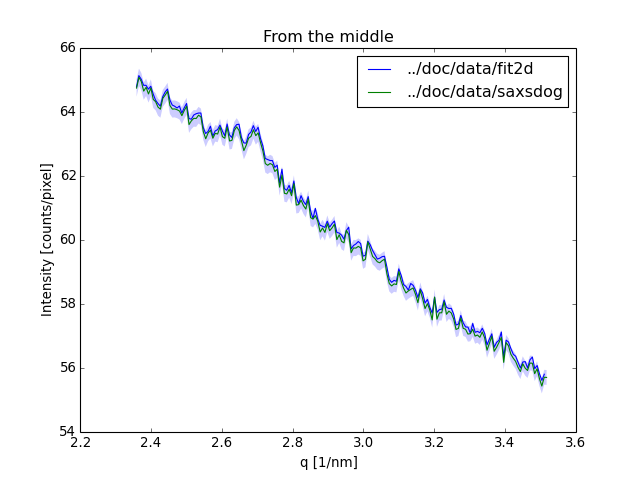
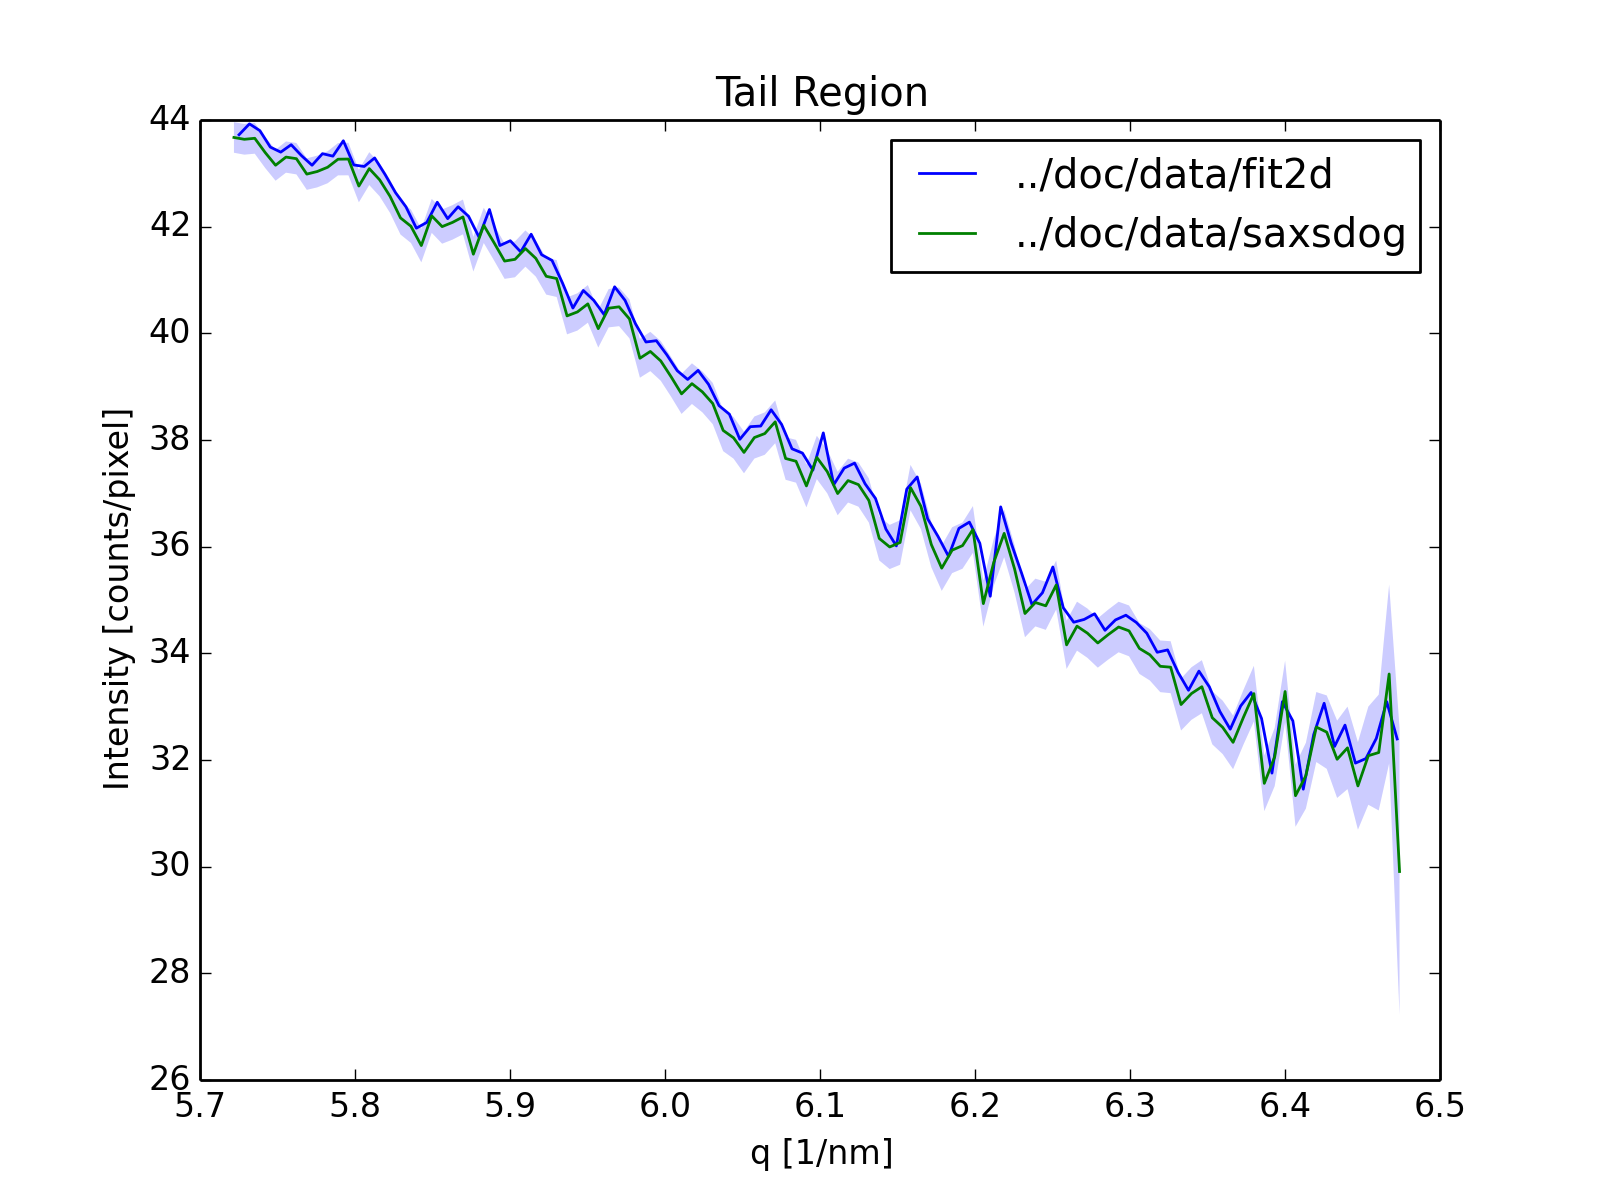
In the tail region the blue halo (Poisson error) signifies that there are not enough counts to make good statistics.
(Source code, png, hires.png, pdf)